NetWatchTower Web
Centralized Observability Command Center
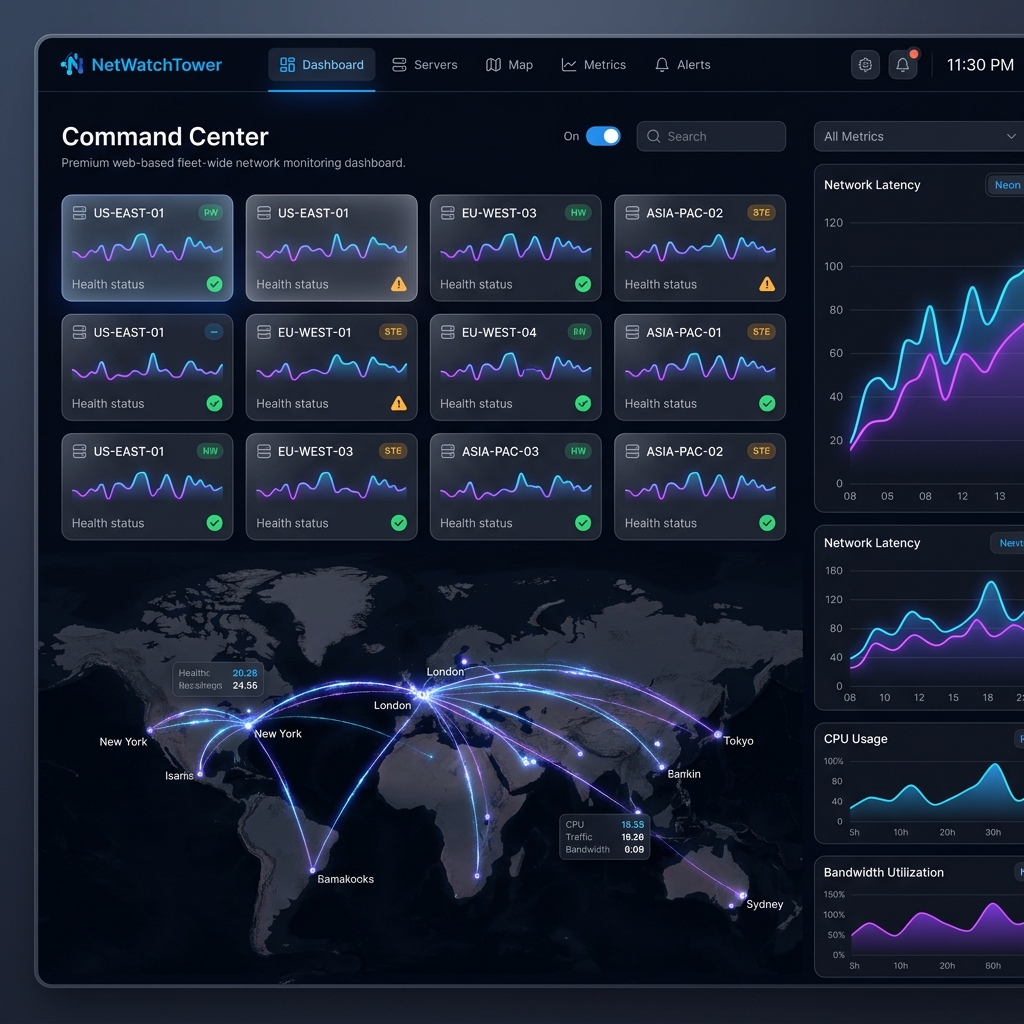
Built a modern, centralized web dashboard for real-time visualization of fleet-wide network health and data pipeline performance.
Business Problem
Infrastructure teams lacked a 'single pane of glass' to view the health of distributed agents, leading to delayed responses to multi-site outages.
Technical Challenges
Aggregating real-time streams from multiple distributed agents and rendering high-frequency data visualizations without performance degradation.
Architecture
A Next.js application using the App Router for efficient server-side rendering and a responsive Tailwind-based UI. Utilizes a centralized API to aggregate metrics from distributed agents.
Implementation
Designed a 'Glassmorphism' command center UI. Implemented real-time status indicators and interactive health charts using Recharts for historical trend analysis.
Scalability
Architected to aggregate and visualize data from hundreds of distributed monitoring nodes simultaneously.
Results / Impact
Significantly improved team response time through centralized alerting and immediate visual identification of infrastructure bottlenecks.
Lessons Learned
Aesthetic clarity in a dashboard is a functional requirement; reducing cognitive load for operators during outages is critical.
Interested in the technical implementation?
Let's discuss how this architecture can be applied to your specific healthcare challenges.